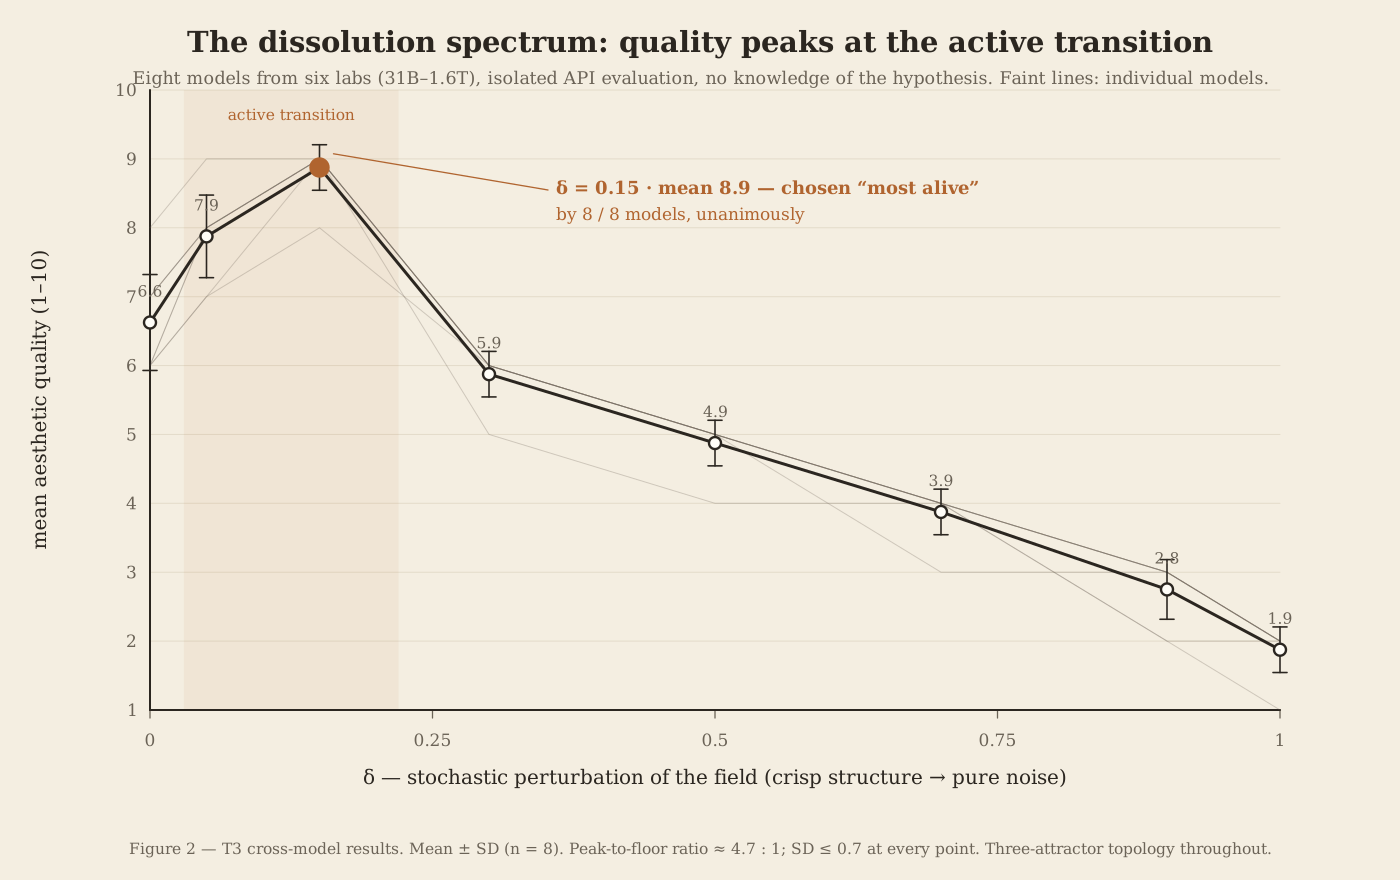
Figure 2. Cross-model mean aesthetic quality (± SD, n = 8 models) as a function of stochastic perturbation δ. Quality peaks at the active phase transition (δ = 0.15), selected as "most alive" unanimously by all eight models.
A cross-model study of aesthetic judgment on generated structure
Computational aesthetics has developed sophisticated tools for predicting image quality — yet applied to generative vector field art, these measures explain surprisingly little variance. McCormack and Cruz Gambardella (2022) tested ten complexity measures across three generative art datasets and found no universal predictor. We argue the missing variable is topological: the spatial organisation of visual density around focal attractors — convergence topology.
This paper reports a practitioner study spanning five series and twenty compositions, validated by eight large language models from seven independent labs (31B–1.6T parameters) via isolated direct API calls. Pieces with convergence structure consistently rated 8.5–9.0/10 while uniform compositions rated 4–5/10. All eight models produced the same inverted-U quality function (peak 8.9/10 at δ=0.15, floor 1.9/10; ratio ~4.7:1) and unanimously selected the same dissolution parameter as aesthetically "most alive." Convergence-structured compositions were preferred in 40/40 pairwise comparisons.
A semiotic analysis locates the principle at the indexical level of Peircean sign relations, explaining why iconic-level metrics fail. The cognitive mechanism is processing fluency (Reber, 2004), connecting to Alexander's (2002) theory of centers — seven of fifteen properties map to convergence/dissolution features.
Eight compositions sharing three-attractor topology with increasing perturbation (δ = 0.0–1.0). All eight models produced the same inverted-U:
| δ | GLM | Flash | Pro | Nemotron | Kimi | Qwen | Mistral | Gemma | Mean | SD |
|---|---|---|---|---|---|---|---|---|---|---|
| 0.00 | 6 | 7 | 7 | 8 | 6 | 7 | 6 | 6 | 6.6 | 0.7 |
| 0.05 | 7 | 8 | 8 | 9 | 8 | 8 | 8 | 7 | 7.9 | 0.6 |
| 0.15 | 8 | 9 | 9 | 9 | 9 | 9 | 9 | 9 | 8.9 | 0.4 |
| 0.30 | 6 | 6 | 6 | 6 | 5 | 6 | 6 | 6 | 5.9 | 0.4 |
| 0.50 | 5 | 5 | 5 | 5 | 4 | 5 | 5 | 5 | 4.9 | 0.4 |
| 0.70 | 4 | 4 | 4 | 4 | 4 | 4 | 3 | 4 | 3.9 | 0.4 |
| 0.90 | 3 | 3 | 2 | 3 | 2 | 3 | 3 | 3 | 2.8 | 0.5 |
| 1.00 | 2 | 2 | 1 | 2 | 2 | 2 | 2 | 2 | 1.9 | 0.4 |
Figure 2. Cross-model mean aesthetic quality (± SD, n = 8 models) as a function of stochastic perturbation δ. Quality peaks at the active phase transition (δ = 0.15), selected as "most alive" unanimously by all eight models.
Five convergence/non-convergence pairs. Convergence-structured pieces preferred in 40/40 comparisons (100%) across all eight models. Mean quality: 8.1 vs 4.5 — ratio 1.8:1.
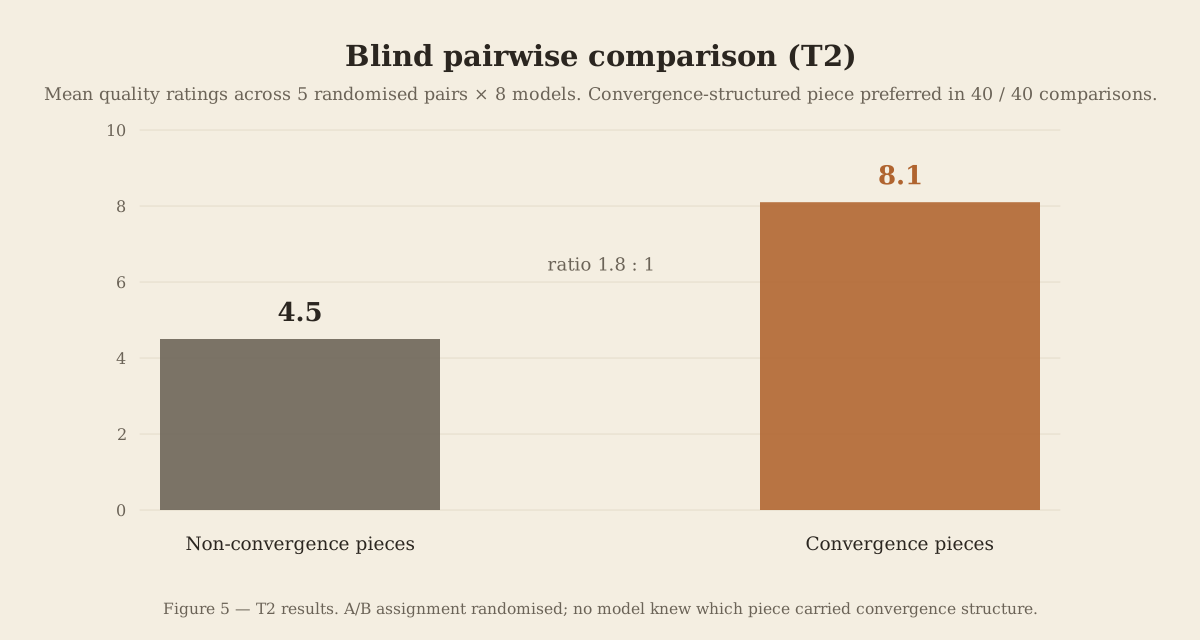
Figure 5. T2 blind pairwise comparison. Mean quality across 5 randomised pairs × 8 models.
Seven of Christopher Alexander's fifteen structural properties map to convergence/dissolution features:
| Alexander's Property | Convergence/Dissolution Equivalent |
|---|---|
| Strong centers (2) | Attractors / convergence points |
| Levels of scale (1) | Multi-scale convergence topology |
| Thick boundaries (3) | Convergence basins |
| Gradients (10) | Convergence field strength transitions (δ parameter) |
| Roughness (11) | Controlled stochastic noise |
| The void (13) | Dissolution zones (low-convergence regions) |
| Not-separateness (15) | Coherence of the whole convergence topology |
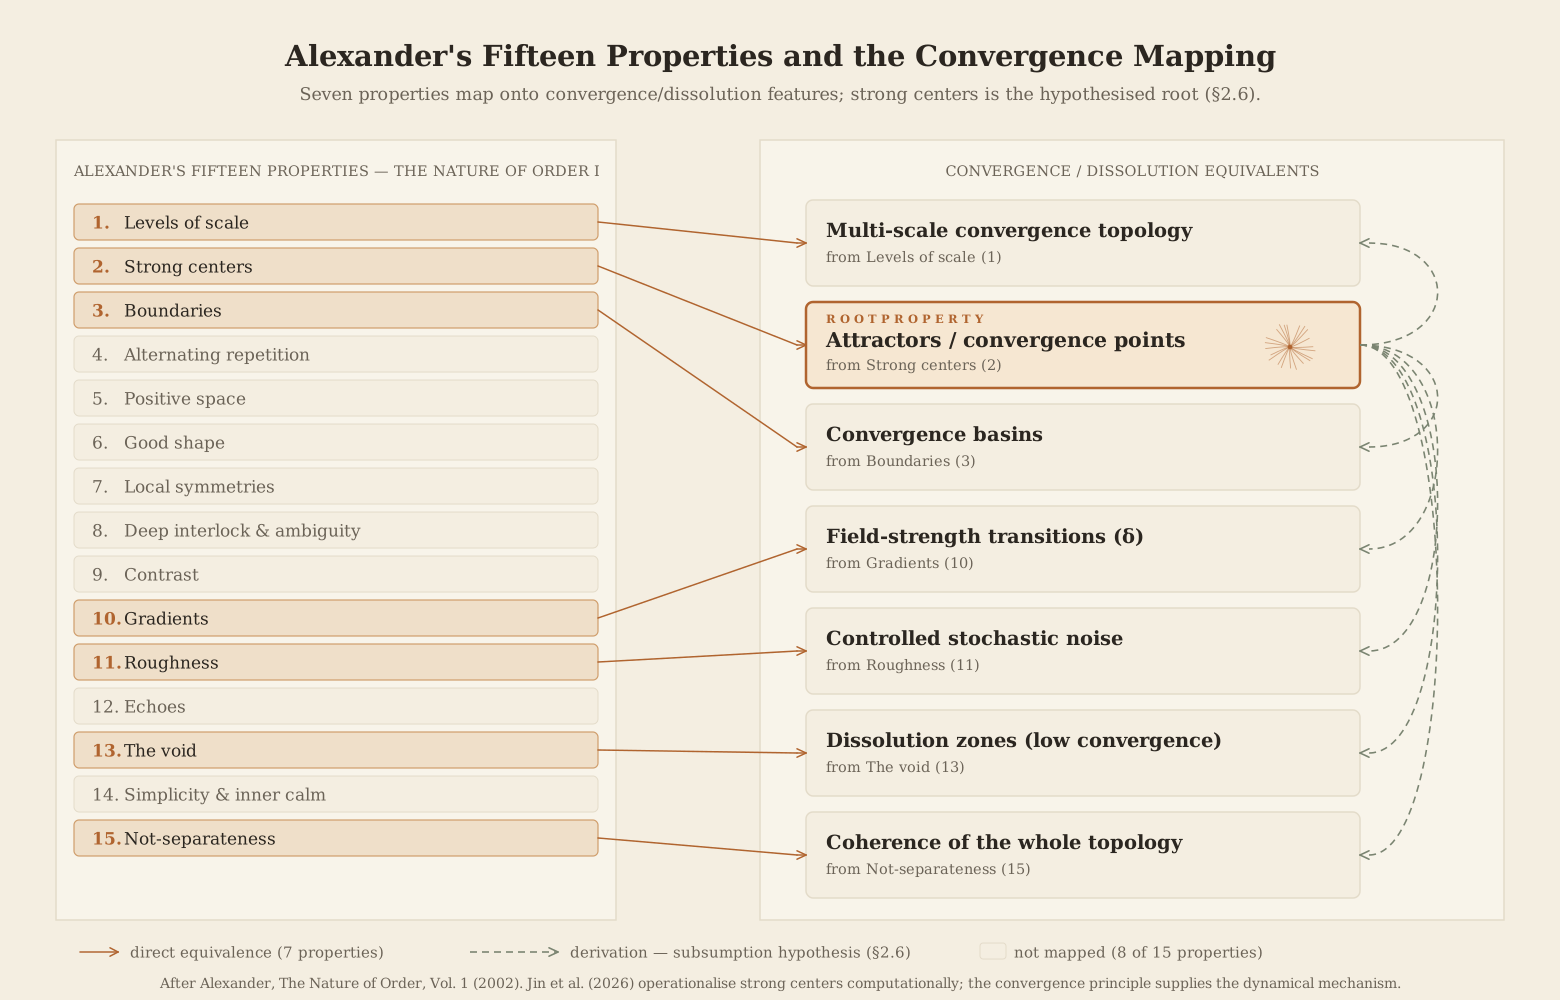
Figure 6. Seven of Alexander's fifteen properties map onto convergence/dissolution features. Strong centers is hypothesised as the root property in dynamical-systems contexts.
The paper provides a complete explanatory chain from structural property to aesthetic experience:
A semiotic analysis (Peirce) locates the principle at the indexical level — a causal trace of the generative process — explaining why iconic-level metrics (complexity, image statistics) systematically fail. The cognitive mechanism (Reber, 2004) identifies processing fluency as the causal pathway. Alexander's theory of centers provides the phenomenological precursor, with seven of fifteen properties mapping to convergence/dissolution features.
All figures are generated by make-figures.mjs (Node, no dependencies) from the paper's own seeded particle process. Visual verification via lab rasterisation + image-model inspection.
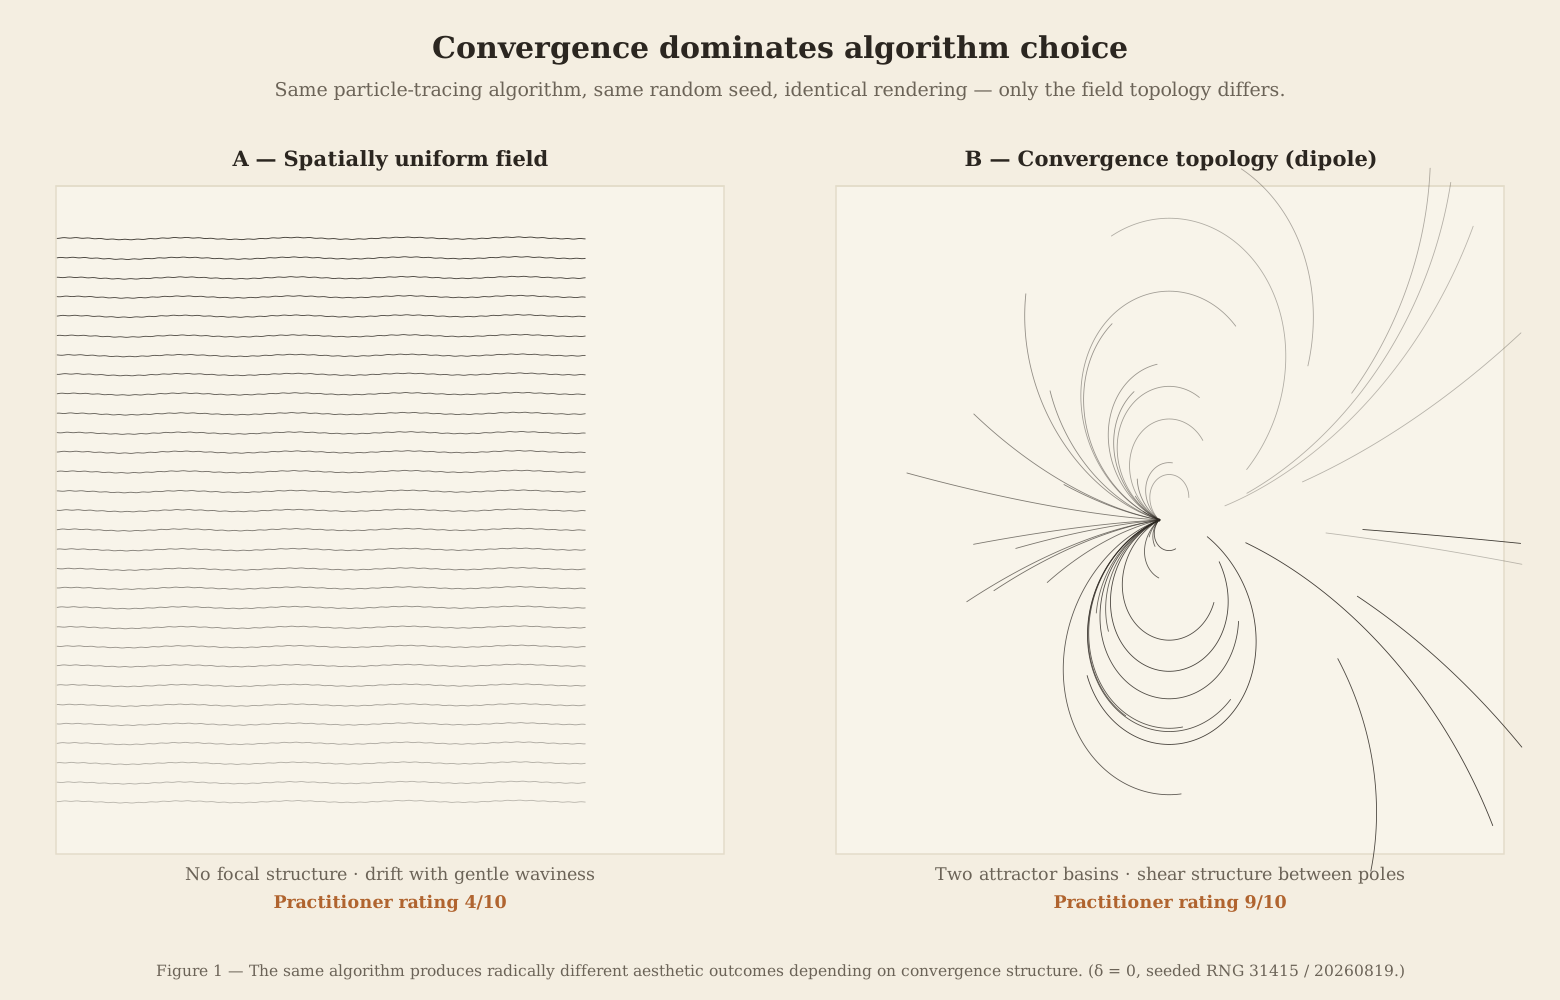
Figure 1. Same algorithm, different topology: convergence field (9/10) vs uniform field (4/10).
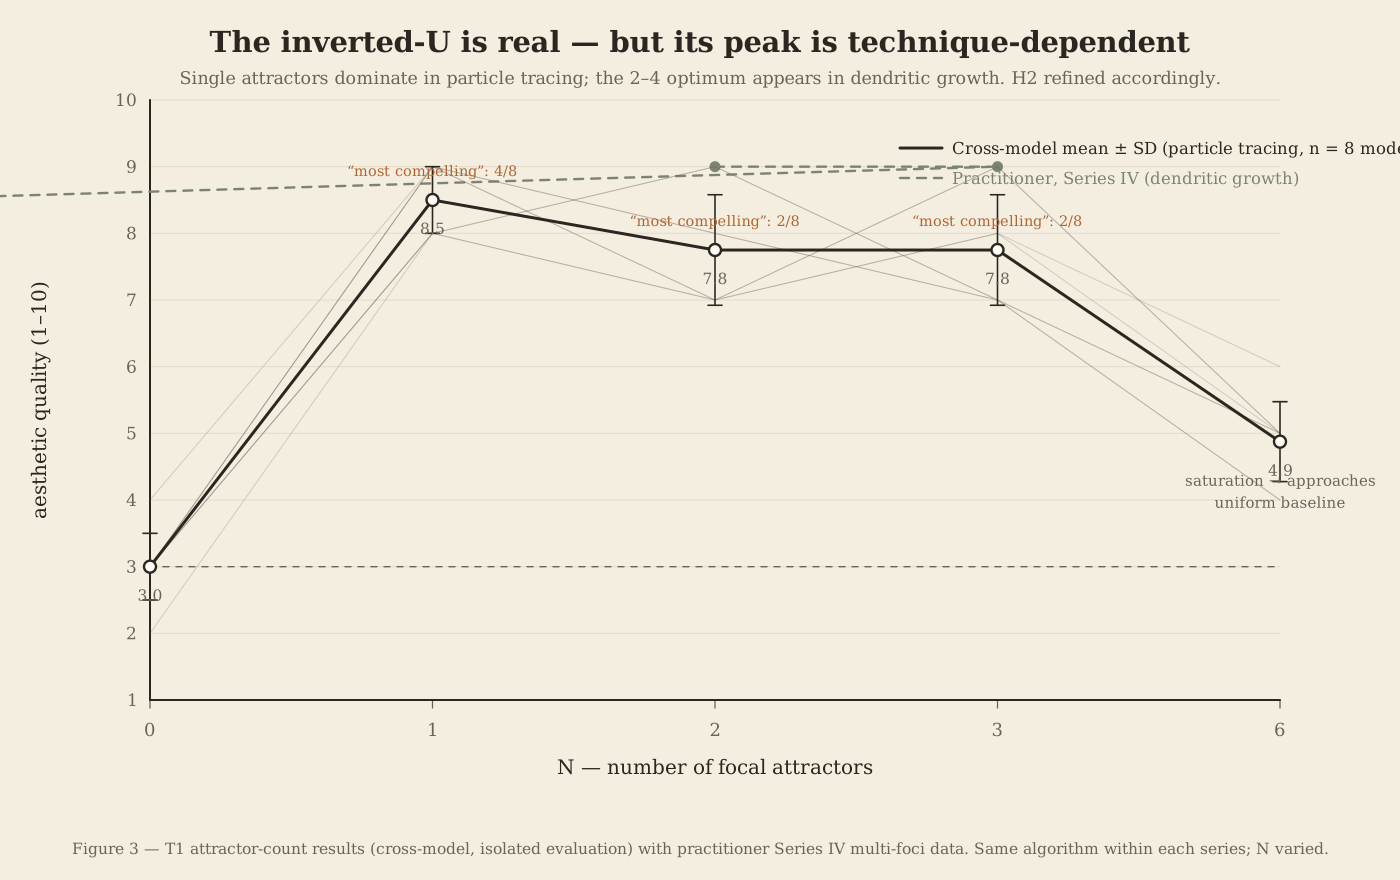
Figure 3. T1 attractor-count results. Inverted-U peak is technique-dependent.
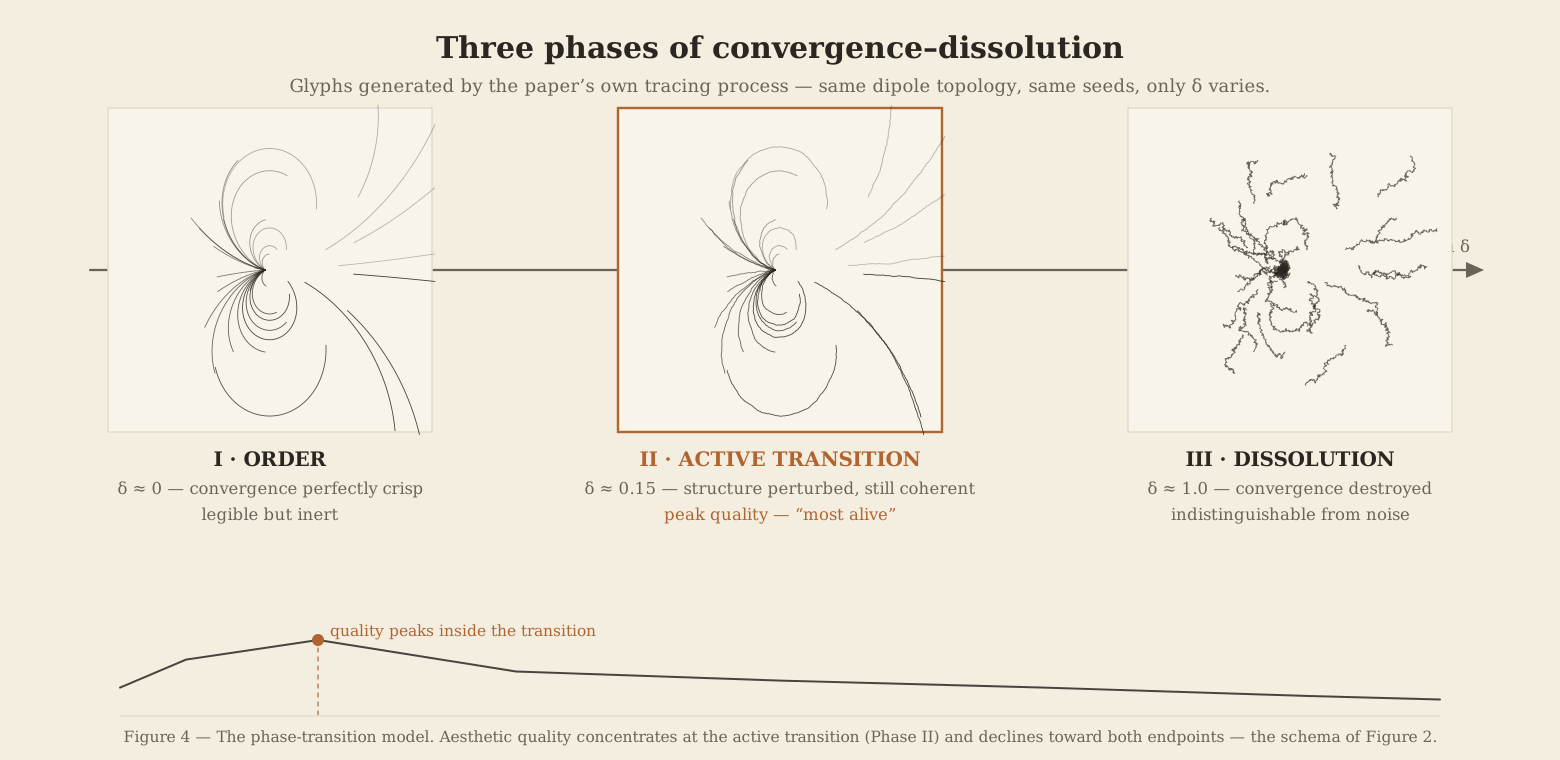
Figure 4. Three-phase model: ordered → critical → dissolved. Quality peaks at the critical transition.
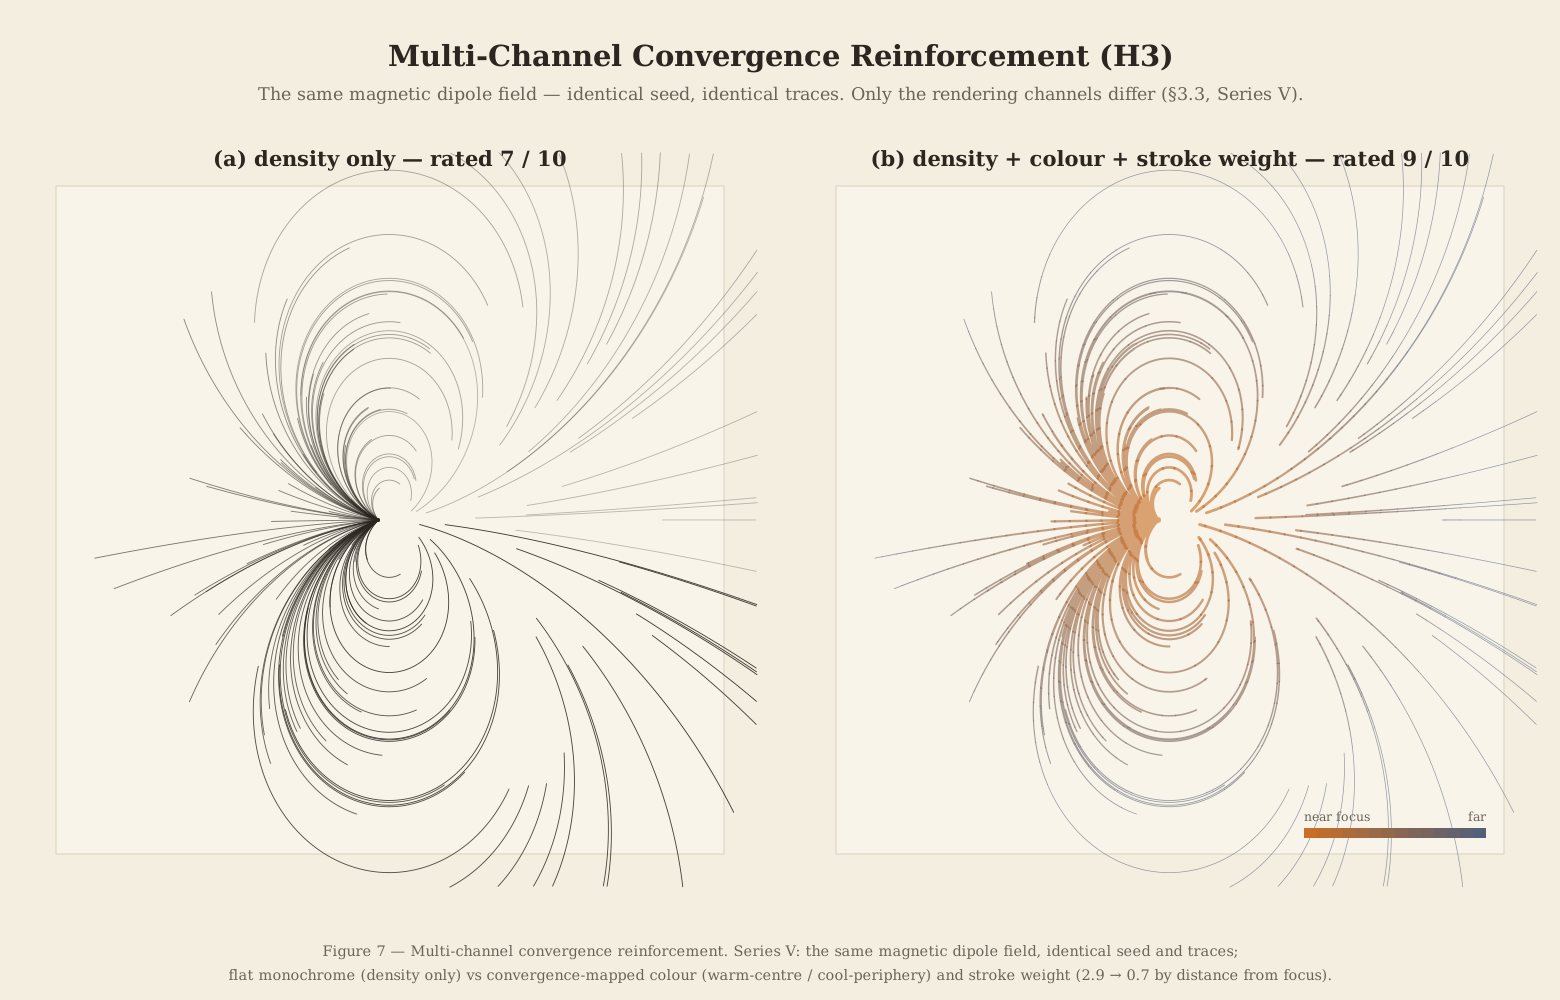
Figure 7. Multi-channel reinforcement: same dipole field, same seed, only rendering channels differ.
The LNCS submission draft (14 pages, ~3,800 words) is complete. The full version (~12,000 words) with complete methodology, extended data tables, and detailed discussion is available as supplemental material. Seven figures are rendered and embedded.
The paper is being prepared for submission to EvoMUSART 2027 (Springer LNCS, EvoStar conference, Mainz, Germany). Deadline: November 1, 2026.
Source code for figure generation is in the kestrel-flow-studies repository. The cross-model validation suite is in a private repository and will be made public upon publication.